Spotify MAU (Monthly Active Users) Analysis and Visualization
Click here to view the dashboard in Tableau
Research Question and Data Overview
The inspiration for this data exploration came from a dataset that I found on Kaggle, titled Spotify Revenue, Expenses and Its Premium Users. This dataset focuses on the cost, revenue, and active user numbers for Spotify's two user types, ad-based (free) and premium (All financial numbers from the graphs are in Euro millions, and all user numbers are in millions). I decided that I would test my knowledge of Tableau and see if I could find some intereseting patterns about these numbers.
Activity Differences Between Free and Premium Users
To start, I was curious about the activity differences between the user types in terms of MAU, which tracks users that have played music for more than 0 milliseconds in the past 30 days. Although there is no sign-up data for new accounts available, I imagine that this data would match the MAU trends pretty closely. I noticed that premium users have had an almost boring, near-perfect linear growth since 2016. Ad-based users, however, have been increasing at a noticably higher percentage over the past 2 quarters (Q4 2022 and Q1 2023). This is the first time that ad-based users have increased by over 20 million users in a quarter, and it has done so twice in a row now.
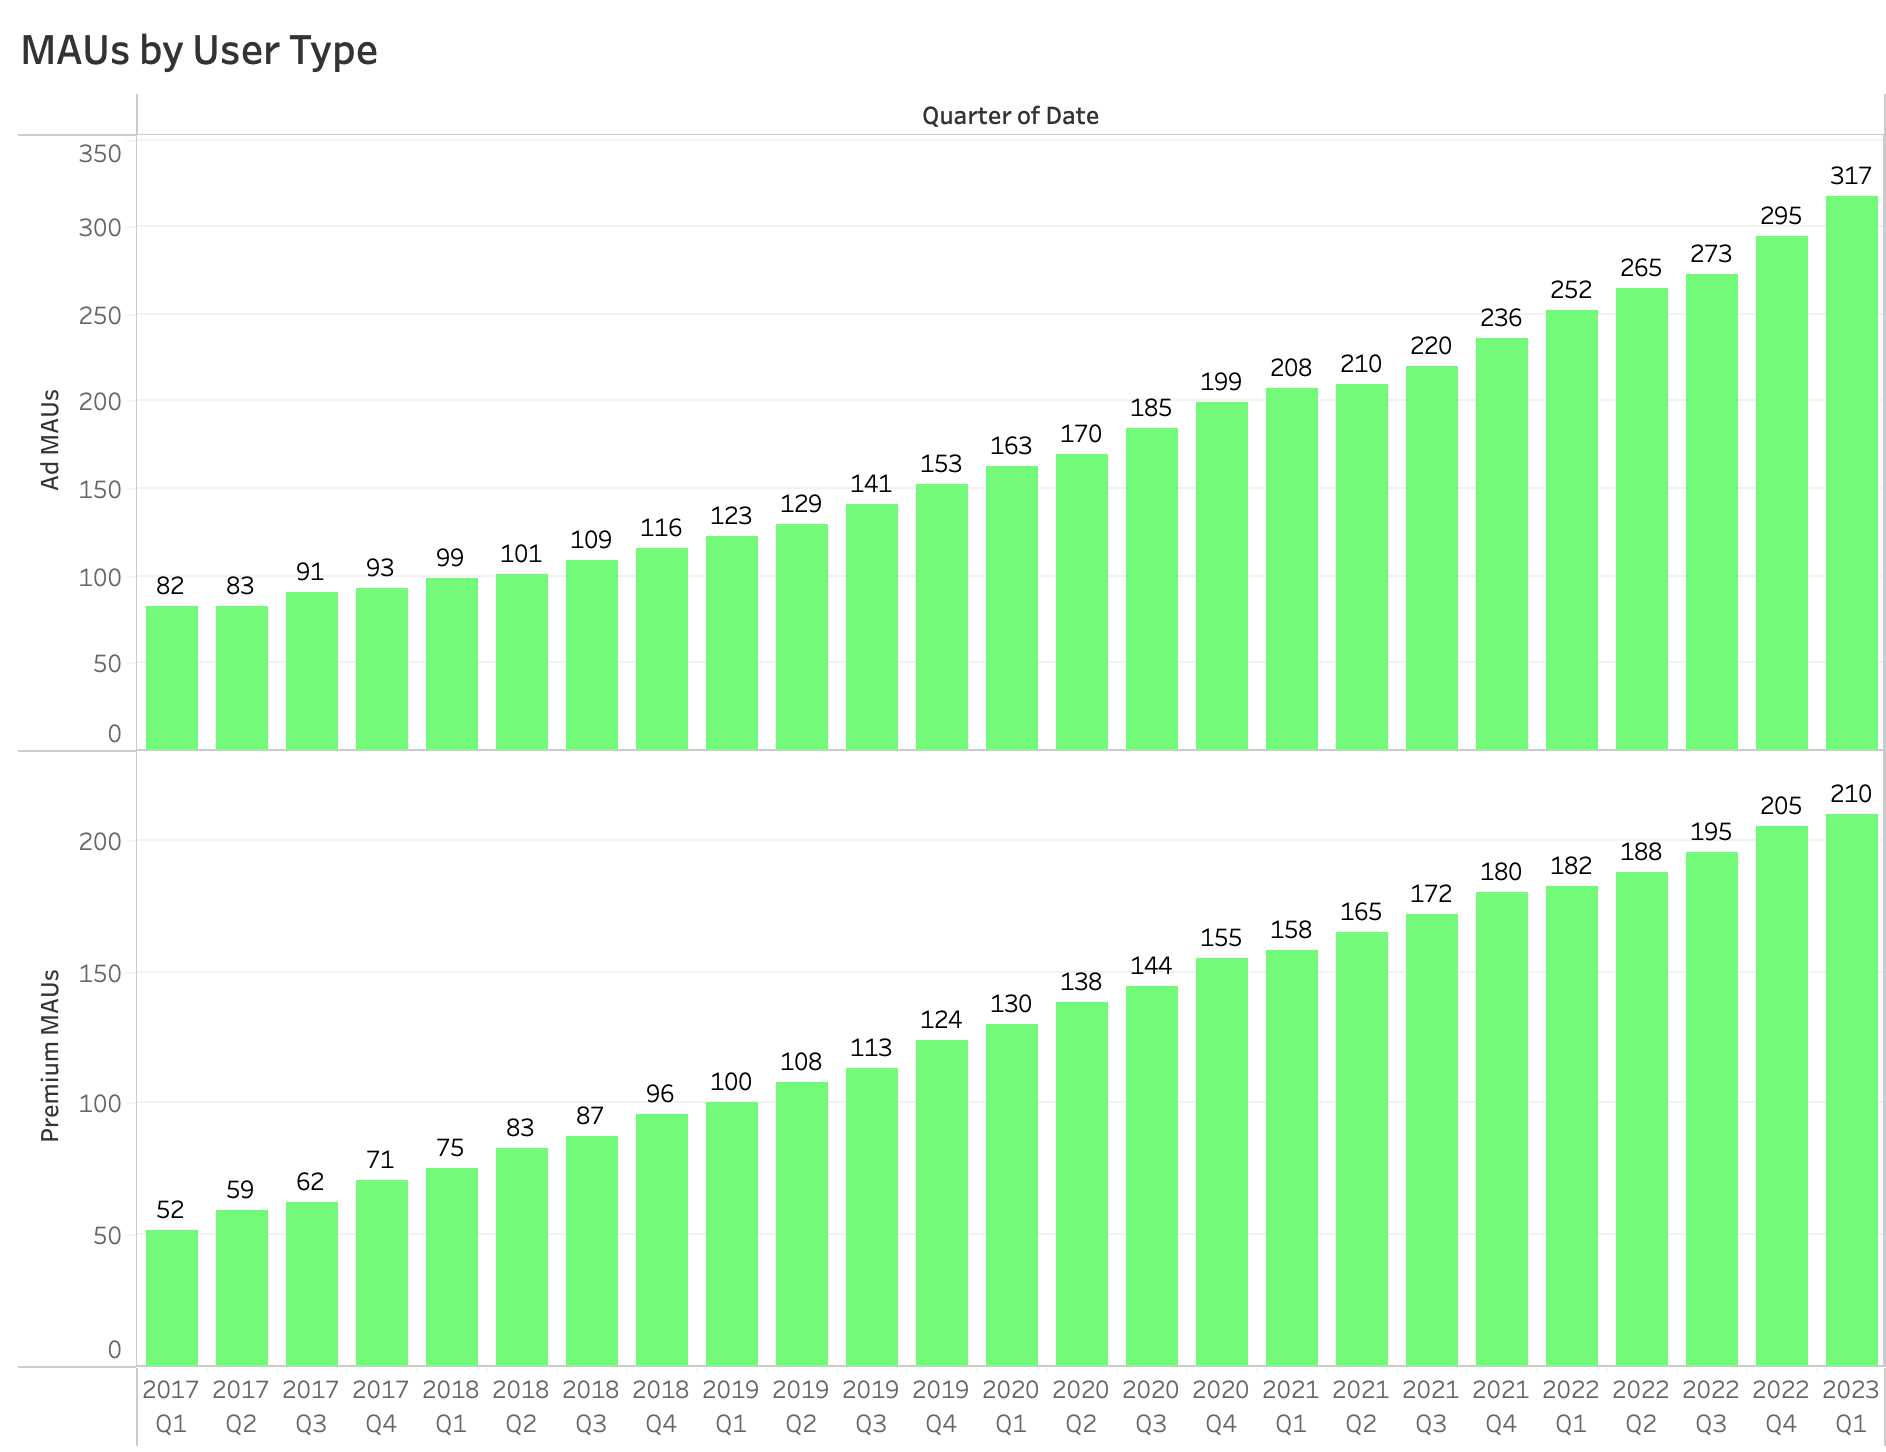
Obviously this got me asking one question: Why would there be a noticable increase? I kept looking through the available data until I found some of Spotify's expense numbers, specifically looking at the difference in their spending between marketing and R&D.
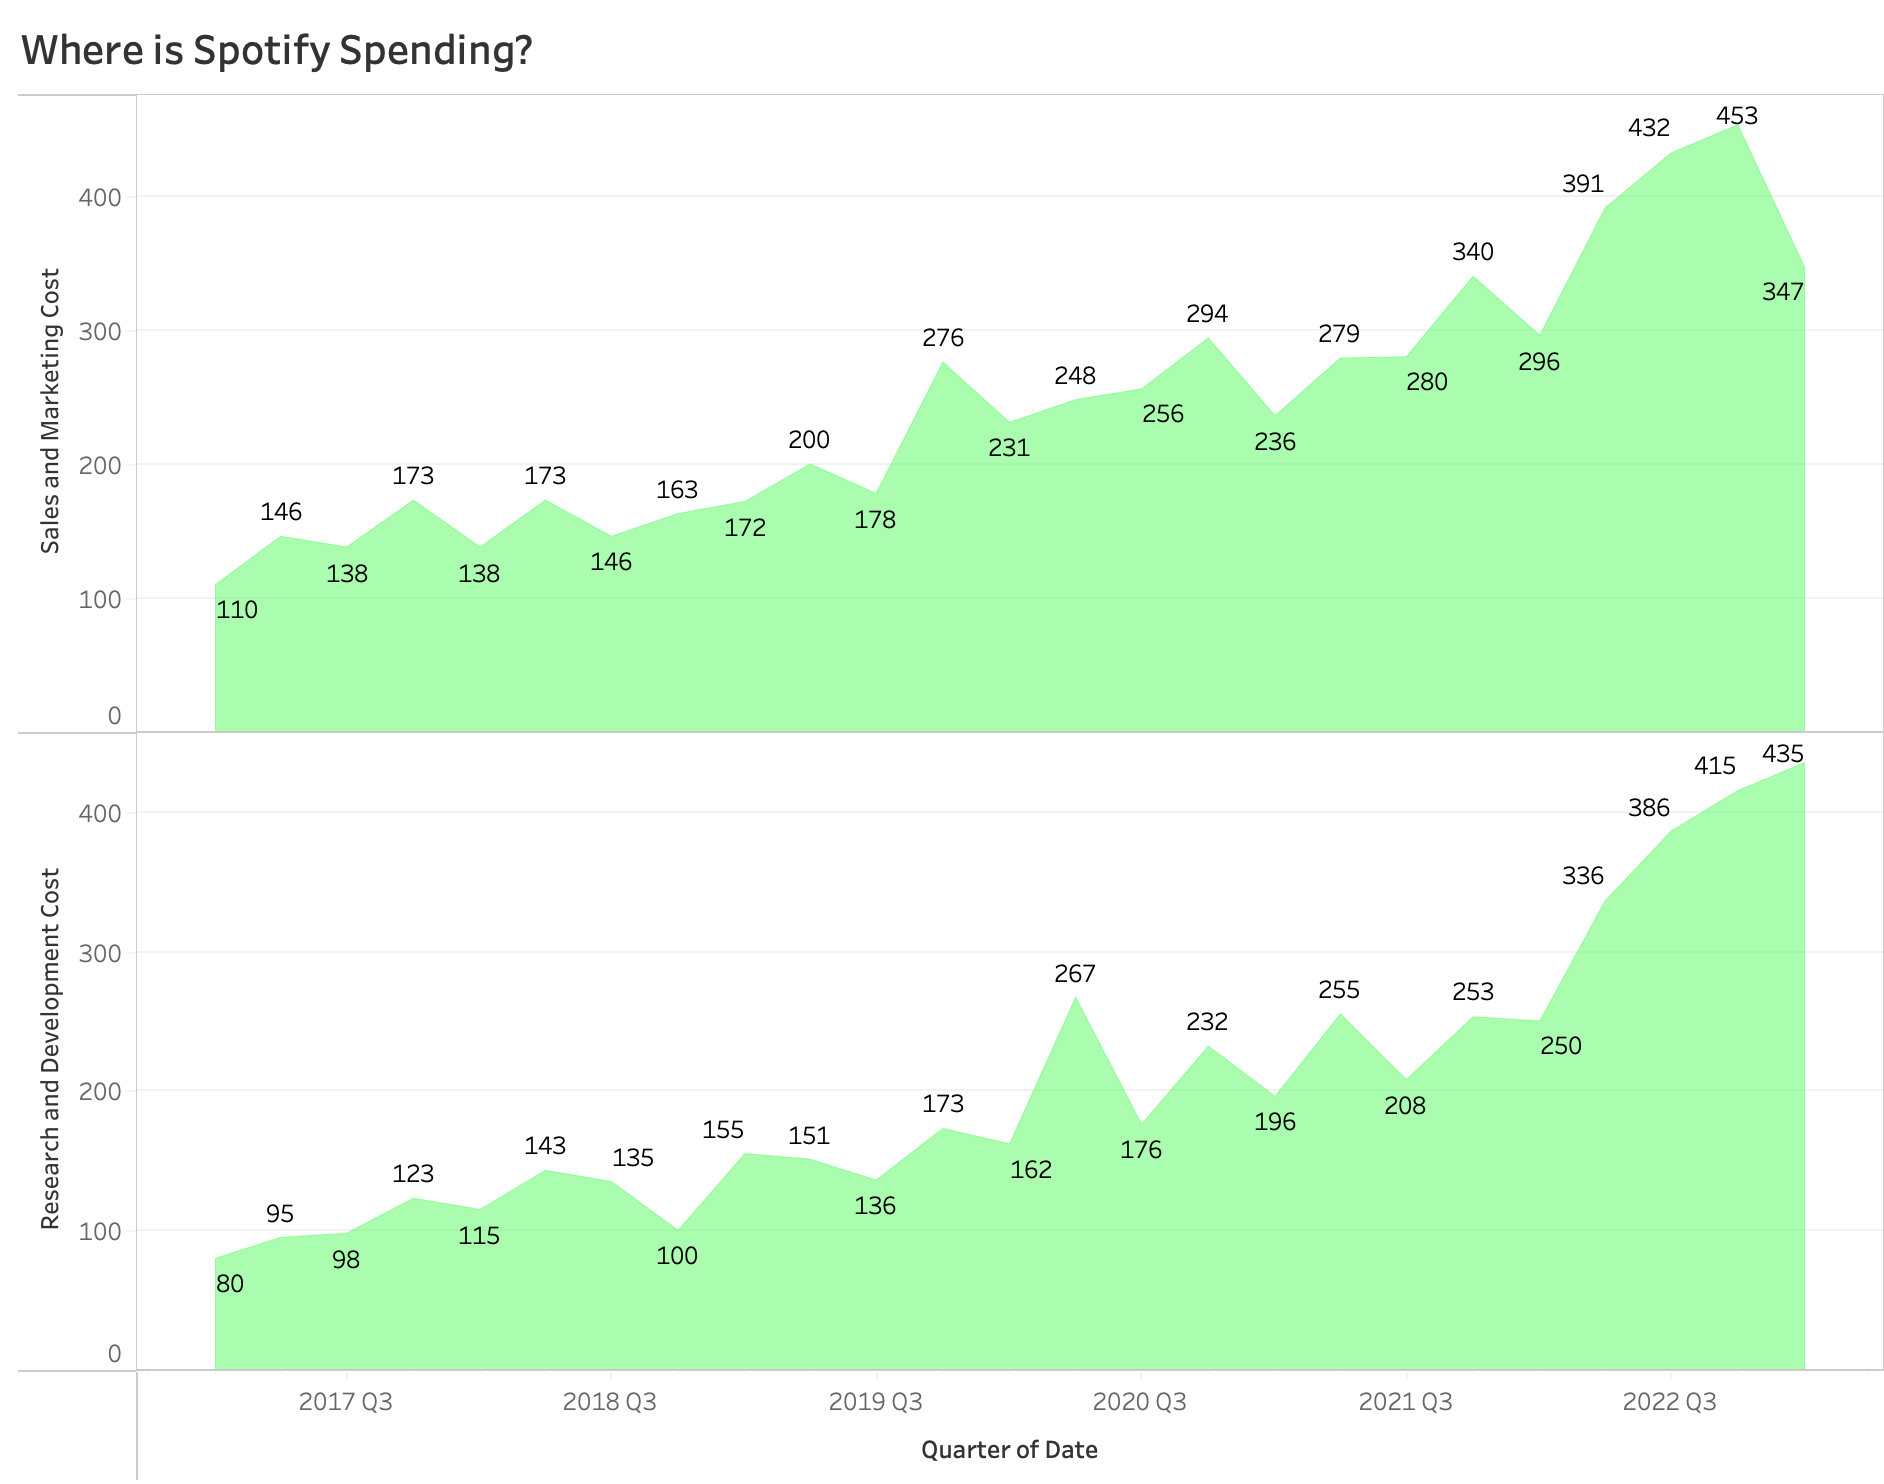
As you can see, Spotify has drastically reduced their marketing and sales spending since the end of last year and have let that take a backseat to their R&D spending. This could definitely be partially influenced by the AI boom, but it is interesting none the less. In order to make sure that the increased spending was actually making differences in their platform, I did some research on their application update history. Spotify has an interesting approach to their update logs, and by that I mean that they don't tell users anything about app changes. The same We’re always making changes and improvements to Spotify. To make sure you don’t miss a thing, just keep your Updates turned on tag is the only public information available. I'm gonna give them the benefit of the doubt and assume that they are making feature improvements in these updates and not just removing existing bugs. The data that I could track was in the form of update frequency. I found that between the beginning of 2022 (the big uptick in R&D spending) and the end of Q1 2023, Spotify had updated their app 65 times. In the previous year, 2021, they only updated their app 46 times (Source). Broken down by quarter, they have increased the number of updates from 11.5 to 13, which most likely means an increase in the amount of new content and features.
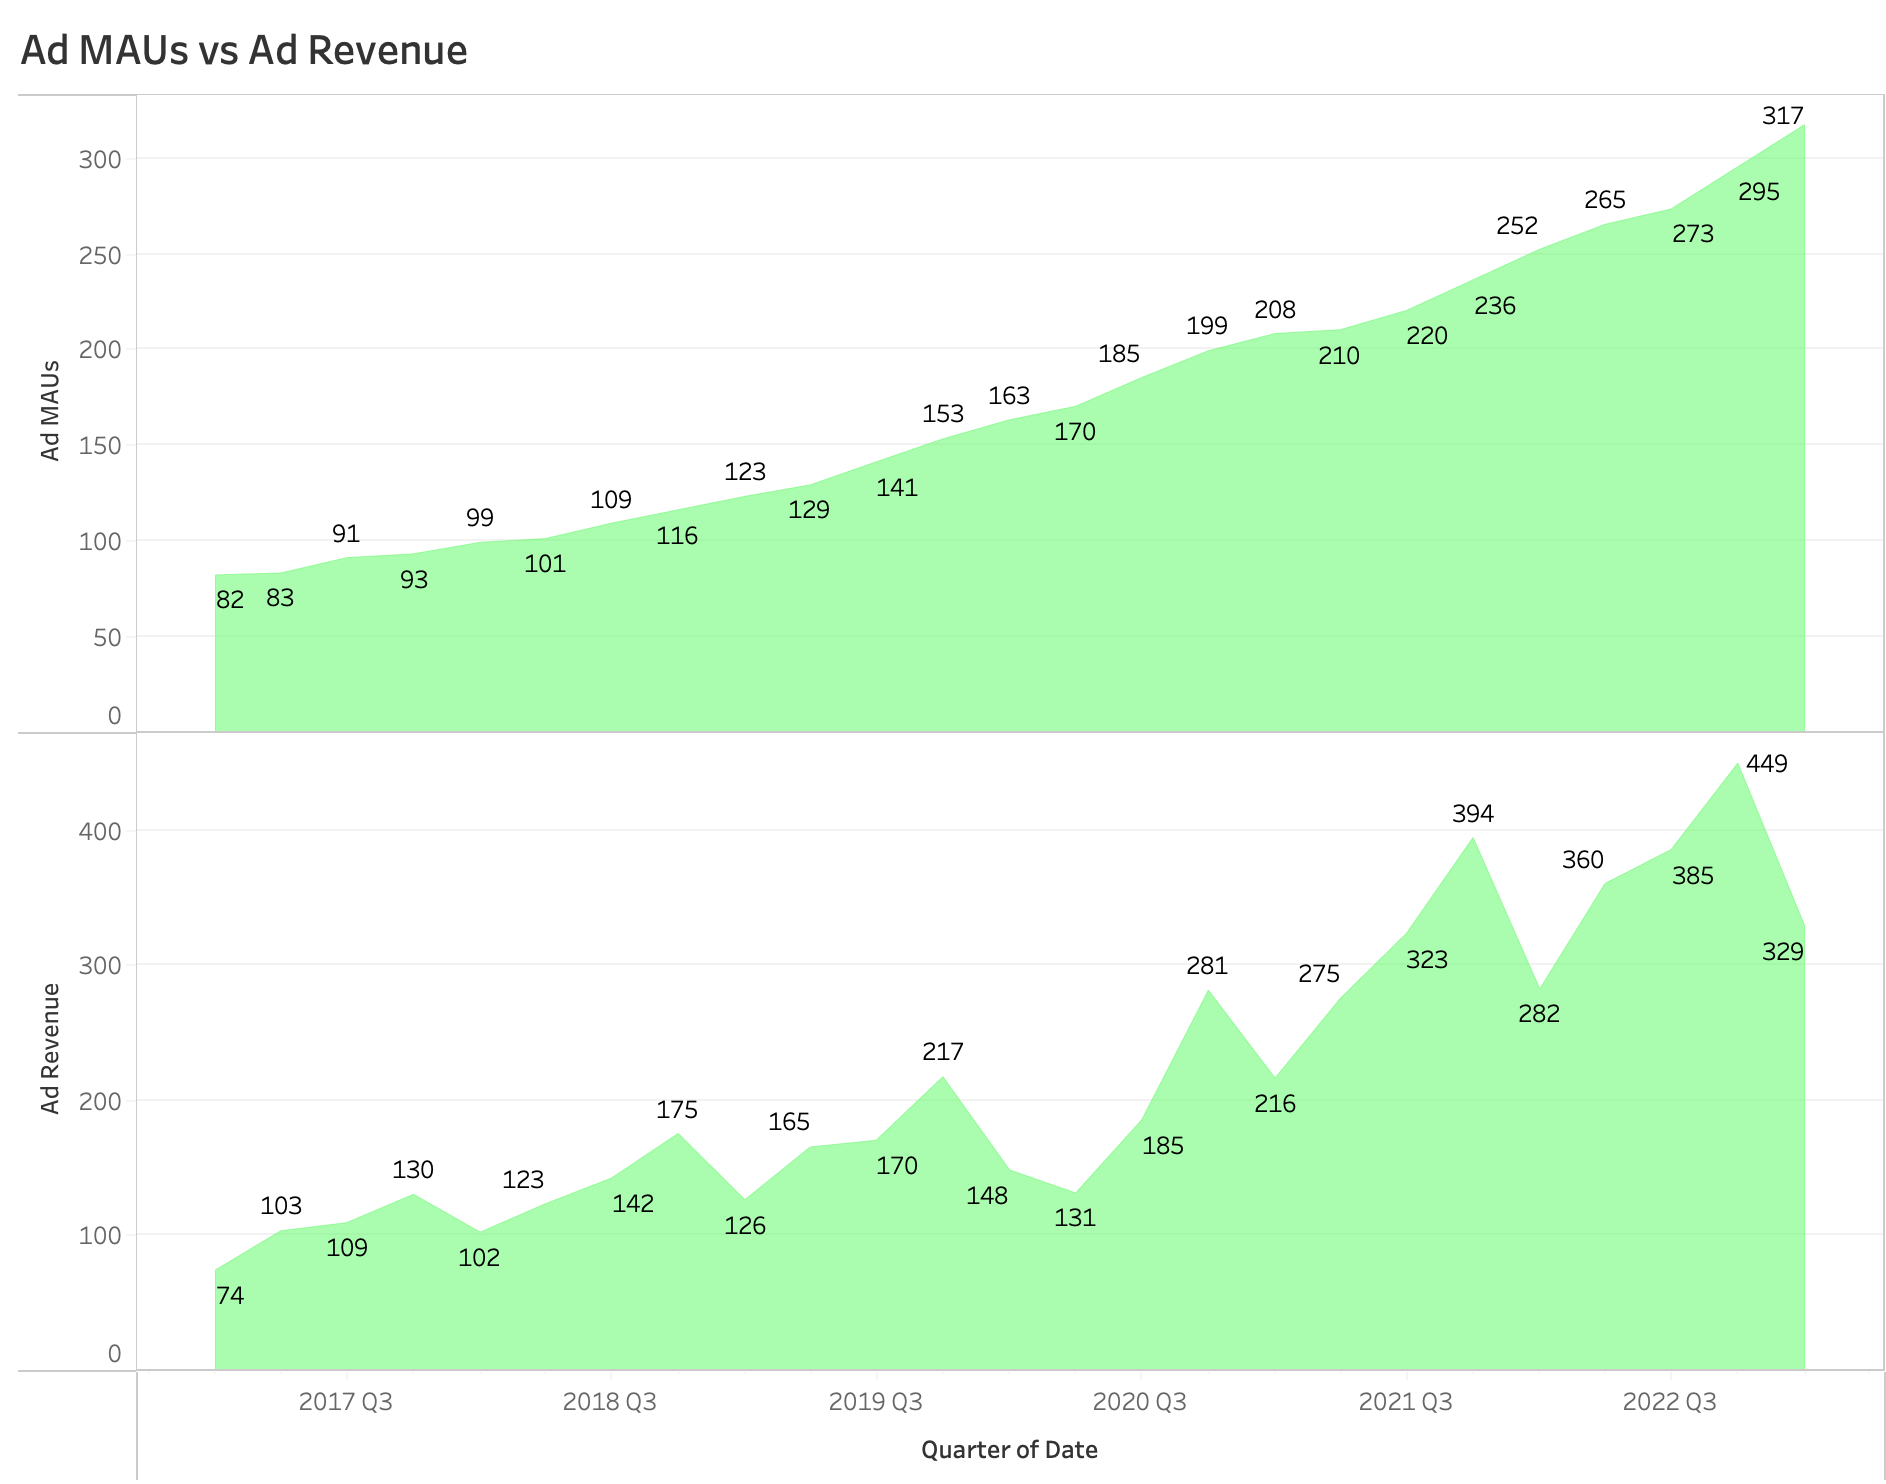
This is pretty good so far, but a bizarre question popped up once I looked at their ad revenue for Q1 2023. I fully expected the ad revenue to match the same uptick as the ad-based MAU chart showed, but to my surprise I found a pretty steep drop off.
Fun Experiment Time
I brainstormed a little bit on why the ad-based MAU increase could correlate with a steep decrease in ad revenue for Spotify. My first thought was to see if they lowered their ad prices to allow for smaller businesses to use this service, but their pricing structure hasn't changed since at least 2021 (Current Pricing and Pricing in 2021). My other thought was that there was a change to Spotify's ad-based platform that made it less incentivising for advertisers. Could Spotify have changed the platform to play less ads for free users? I absolutely had to know. I did some more research and found multiple reports from 2022, in which ad-based users stated that they got ad breaks between every 2-3 songs (Source). I downloaded Spotify (Yeah, I'm an Apple Music enthusiast) and decided to see if I got different numbers than these reports. To do this, I listened to 41 total songs in a row and tracked how often an ad break came on (Trust me, this experiment was as gruelling as it sounds). Here were my results:
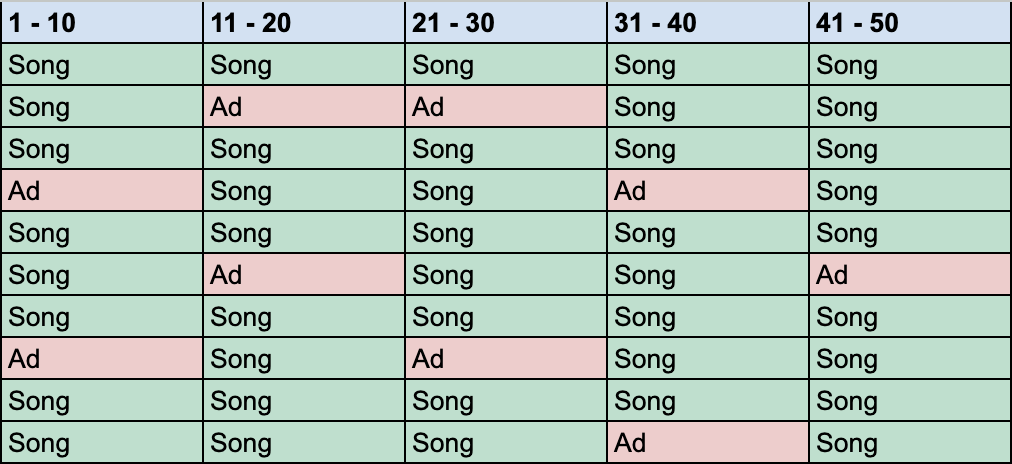
Out of 41 songs listened to, there were 9 ad breaks. That roughly translates to an ad break every 4.6 songs. When you extrapolate this over an entire hour, with an average song time of 3 minutes (This is for you pop, hip hop, and country fans, not the jazz and classical lovers), the total number of ad breaks based on the 2022 reports would be 8, while my data showed a respectable 4.39, a 45% reduction. If these trends hold true over a long period of time for each user and advertisers know this, it's no wonder that some of them pulled back or quit Spotify advertising entirely.
Impacts on the Business Model
This brings me to my last question, is the decrease in ad revenue hurting Spotify a lot? The answer here isn't just a simple yes or no, but I do believe that it leans more on the no side. Here is their ad revenue side-by-side with their gross profits:
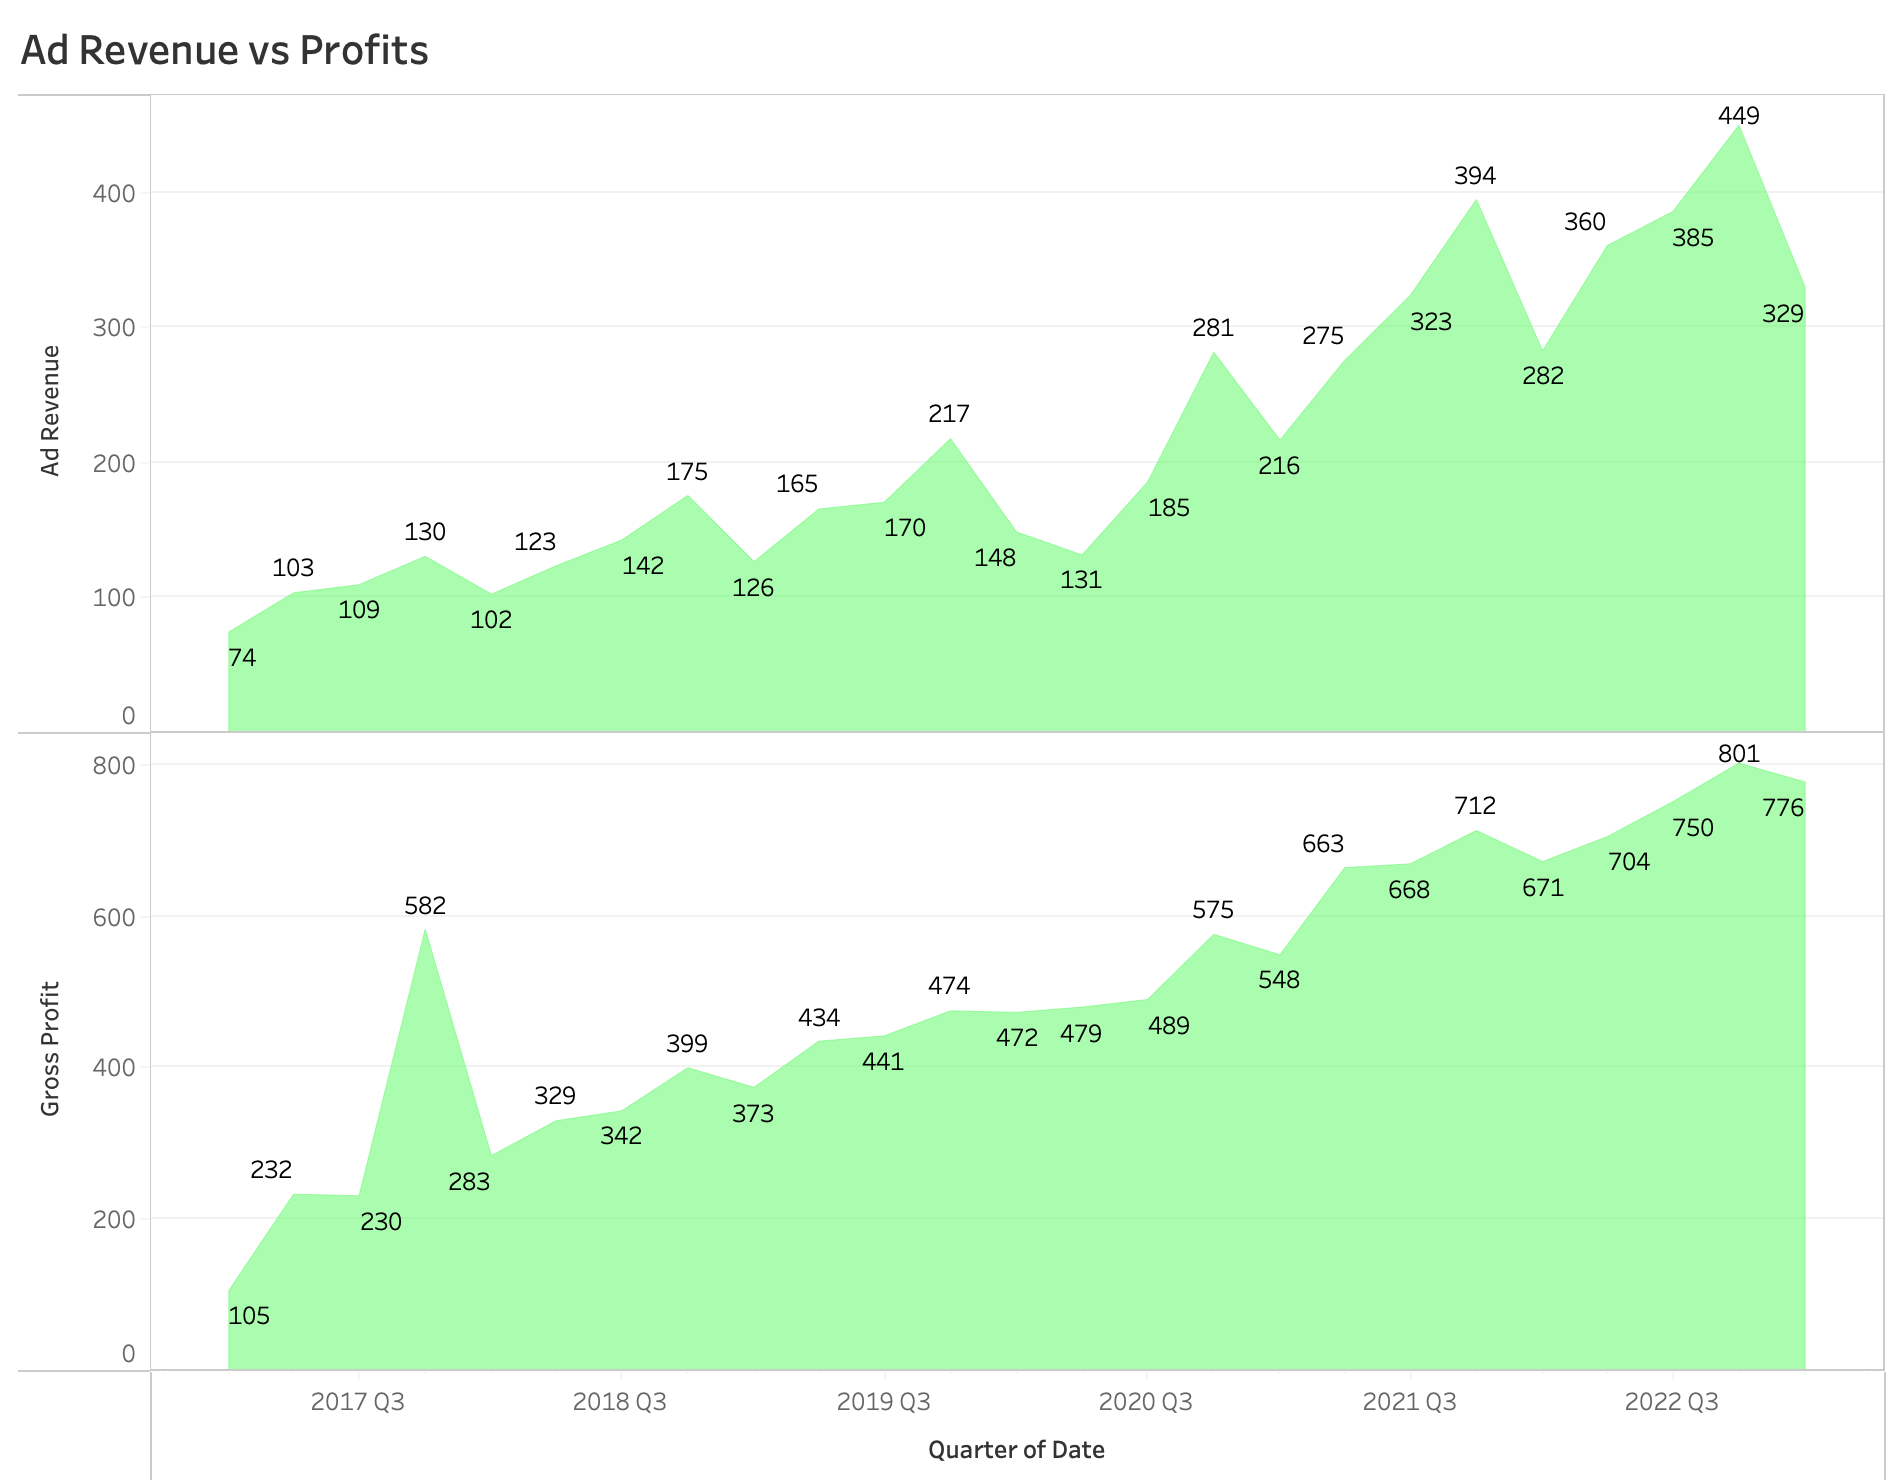
Although there is a decline in profit during Q1 2023, the addition of lower marketing spending and most likely some other costs cut throughout the business resulted in a much more gradual decline. I think that this bodes well for their platform and shows that there is a legitament path forward for them to develop a phenominal free service that could take market space from companies like Pandora and Soundcloud. If they can grow the free user base enough, advertisers will have to continue to invest in their service and it would be a win-win for everyone.